A parent working in the United States needs to send USD 10,000 for their child's tuition in Germany. Walking into a major bank to initiate a wire transfer, the euros delivered to the recipient account reflect an exchange rate two to three hundred dollars worse than the mid-market wholesale rate, before factoring in upfront wire fees. Switching to a mobile remittance app, the screen clearly displays a flat service fee alongside an exchange rate, totaling forty to fifty dollars. Meanwhile, a friend recommends sending USDC, claiming that on-chain transfer fees cost only a few pennies. Yet walking through the actual flow—buying tokens, transferring them across the blockchain, selling them for euros on an exchange, and withdrawing the fiat balance to a German bank account—reveals fee checkpoints at every turn.
Why do these three routes differ so dramatically, and where does the money actually go? In October 2026, the Bank for International Settlements (BIS) published Working Paper No. 1385, titled Competing rails for cross-border payments: banks, fintechs, and stablecoins, authored by Wenxin Du, Catherine Huang, and David Scharfstein of Harvard Business School[1]. The paper establishes a unified all-in cost framework to compare traditional bank wires, non-bank money transfer operators, and stablecoin rails side by side, pinpointing precisely where fees are extracted along each journey. Originally presented at the 25th BIS Annual Conference in June 2026, the paper includes a detailed discussion by Tobias Adrian of the International Monetary Fund (IMF)[2].
Following that USD 10,000 tuition transfer, this article examines how each of the three rails operates, how account balances shift behind the scenes, where costs are deducted, and what the paper's analytical boundaries and the IMF's supplementary findings reveal about cross-border payments.
1. Measuring Three Rails with the Same Yardstick
1. The Questions the Paper Seeks to Answer
Over the past decade, instant payment systems have proliferated worldwide, enabling domestic transfers that settle within seconds and cost virtually nothing. Cross-border retail payments, by contrast, have evolved far more sluggishly. The Group of Twenty (G20) established a global target to bring the average cost of remitting USD 200 below 3%; yet according to 2025 Financial Stability Board (FSB) monitoring data, global average remittance costs remain stubbornly around 6.5%[2].
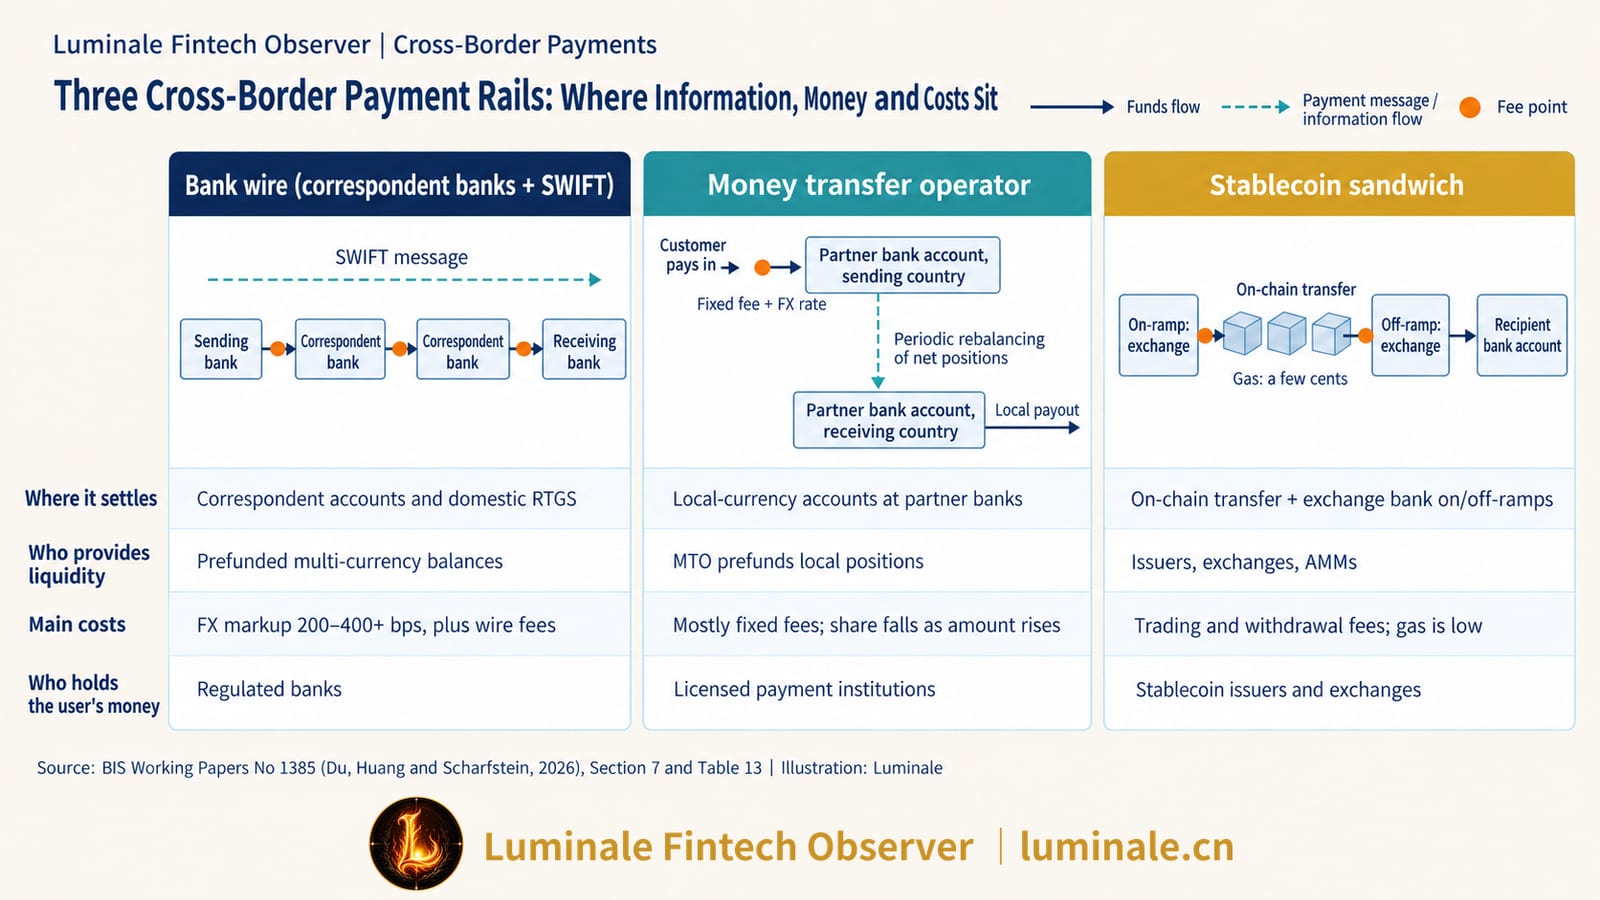
The paper compares three distinct payment rails. The first is traditional bank wire transfers routed through correspondent banking networks and coordinated via Society for Worldwide Interbank Financial Telecommunication (SWIFT) messaging. The second comprises non-bank money transfer operators (MTOs)—such as Wise, Remitly, and the digital arms of Western Union. The third is stablecoin rails, predominantly implemented as what the authors term a "stablecoin sandwich": a sender converts domestic fiat currency into a US dollar stablecoin, transfers it over a public blockchain, and the recipient converts it back into local fiat.
2. How All-In Cost Is Calculated
Different intermediaries package their pricing differently. Banks routinely conceal costs within foreign exchange rate markups; MTOs typically display upfront flat fees alongside an explicit rate; and stablecoin channels partition expenses into crypto exchange trading commissions, fiat withdrawal fees, and on-chain network gas. Evaluating a channel by its fee schedule alone—or by its exchange rate alone—inevitably distorts the true cost.
To resolve this opacity, the paper introduces a standardized metric for all-in cost:
The authors employ two benchmark rates. For transactions lacking precise timestamps, the Bloomberg New York 5:00 PM closing rate serves as the reference; for timestamped data, Bloomberg 30-minute executable fixings (BFIX) are utilized[1].
3. Where the Data Comes From
The empirical foundation of the paper rests on five primary datasets[1]:
- The World Bank Remittance Prices Worldwide (RPW) database, published quarterly across more than 300 remittance corridors for fixed transfer amounts of USD 200 and USD 500, predominantly covering flows from developed to developing economies;
- High-frequency scraped pricing data collected every 30 minutes from the websites of four leading MTOs, spanning roughly 100 corridors across four transaction tiers—USD 200, USD 500, USD 10,000, and USD 50,000—commencing in January 2026;
- Transaction-level foreign exchange wire records from 2024 to 2025 originating from a US community bank and an educational institution utilizing a shared business-to-business (B2B) fintech platform;
- A sample of retail international wire transfers executed directly by one of the co-authors through major global commercial banks;
- Cryptoasset market microdata, including fiat-to-stablecoin execution prices and trade volumes aggregated by CoinDesk, exchange fee schedules, on-chain network fee metrics from Token Terminal, and decentralized exchange (DEX) FX data compiled via Dune.
To facilitate cross-currency comparisons, the paper segments currencies into four tiers. Tier 1 encompasses the US dollar, euro, Japanese yen, and British pound. Tier 2 covers the remaining seven Group of Ten (G10) currencies, plus the Hong Kong dollar and Singapore dollar. Tier 3 includes the ten most heavily traded emerging market currencies identified in the BIS Triennial Central Bank Survey: the Chinese renminbi, Indian rupee, South Korean won, Mexican peso, New Taiwan dollar, Brazilian real, South African rand, Polish zloty, Indonesian rupiah, and Turkish lira. All remaining currencies are classified into Tier 4[1].
4. Spreads in the Wholesale FX Market
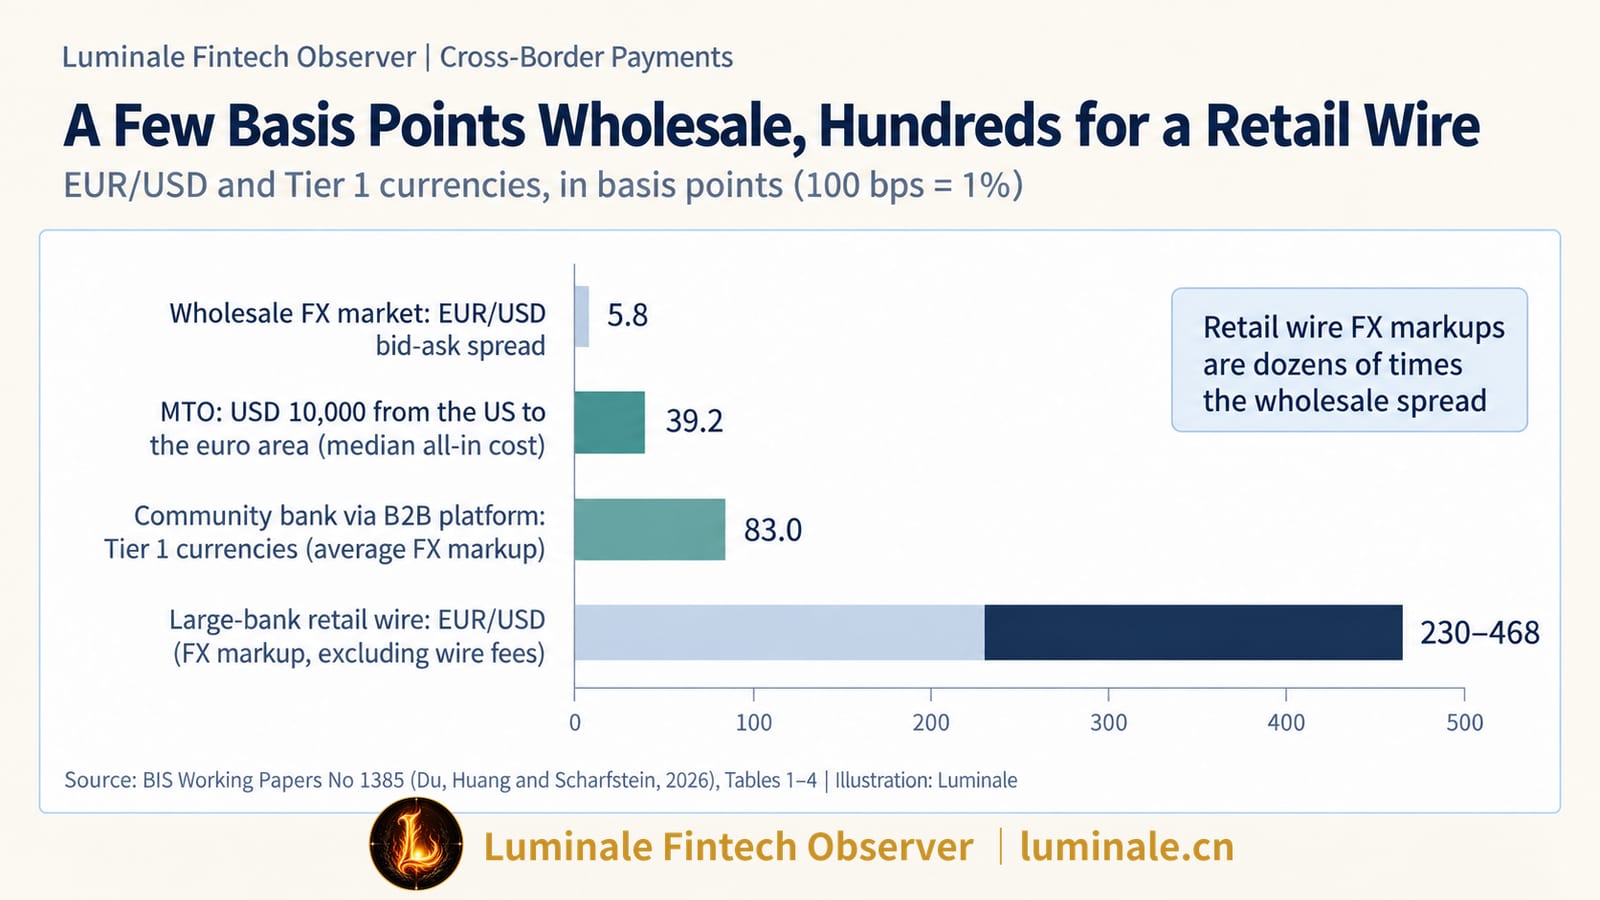
The paper benchmarks all retail pricing against the wholesale foreign exchange market. The 2025 BIS Triennial Survey indicates that global daily foreign exchange turnover reached approximately USD 9.5 trillion in April 2025, with USD transactions accounting for USD 8.5 trillion. Based on Bloomberg New York closing quotes from 2020 through 2025, the average wholesale bid-ask spreads for EUR/USD, JPY/USD, and GBP/USD stood at roughly 5.8, 7.1, and 9.0 basis points, respectively, while USD/CNY traded around 3.7 basis points[1].
In the wholesale market, exchanging major currencies costs only a handful of basis points. Retail customers, by contrast, routinely pay markups ranging from dozens to hundreds of basis points. This vast discrepancy cannot be attributed to an absence of underlying foreign exchange liquidity. The authors conclude that retail markups stem primarily from structural frictions within payment rails, balance sheet absorption, regulatory compliance overhead, and pricing power[1].
5. Structural Comparison of the Three Rails
| Dimension | Bank Wire (Correspondent Banks + SWIFT) | Money Transfer Operator (MTO) | Stablecoin Sandwich |
|---|---|---|---|
| Information Flow | SWIFT messages forwarded sequentially across multiple correspondent banks | MTO proprietary messaging integrated with local domestic payment rails | Public blockchain ledger records combined with exchange and gateway APIs |
| Settlement Location | Reciprocal nostro/vostro accounts and national RTGS systems | Domestic currency accounts held at local partner banks; only net imbalances cross borders | On-chain token transfers; fiat legs enter and exit via crypto exchange partner bank accounts |
| Liquidity Provider | Correspondent banks prefunding multi-currency balances backed by daylight overdrafts | MTOs prefunding local currency positions in advance, managed with FX hedging | Stablecoin issuers, centralized exchanges, and on-chain automated market makers (AMMs) |
| Primary Cost Center | FX markup (routinely 200–400+ bps in retail), plus flat wire fees | Flat fees plus stated FX rates; all-in cost drops substantially as transfer amount grows | Exchange trading commissions, fiat withdrawal fees, and gas; flat charges disproportionately penalize small transfers |
| Counterparty Trust | Heavily regulated commercial banks with statutory deposit insurance and established legal recourse | Licensed payment institutions with customer funds segregated and safeguarded by partner banks | Stablecoin issuers and centralized exchanges operating under evolving regulatory frameworks |
Summary based on Section 7 and Table 13 of the paper[1].
2. Bank Wires: Costly Correspondent Chains and Retail Pricing Power
1. Three Cost Drivers of the Correspondent Banking Model
No commercial bank maintains direct account relationships with every bank worldwide. When a customer in Country A sends funds to a recipient in Country B, the sending bank typically routes the payment through one or more correspondent intermediaries. Interbank settlement occurs by adjusting credit balances across reciprocal nostro and vostro accounts, or by interfacing directly with national Real-Time Gross Settlement (RTGS) systems. SWIFT merely transmits standardized, authenticated financial messages; it executes no settlement of funds itself[1]. For operational mechanics of this architecture, see What Really Happens in a Cross-Border Payment? Correspondent Banking, SWIFT, and Global Payments Reform.
The authors trace three structural cost drivers embedded in this correspondent hierarchy[1]:
First, an international wire transfer must frequently traverse multiple correspondent tiers. Each intermediary institution levies processing fees or embeds an additional markup into the conversion rate, leaving the sender uncertain of the exact amount that will ultimately reach the beneficiary.
Second, correspondent banks must maintain idle, prefunded balances across numerous currencies to fulfill daily settlement obligations and manage time-zone misalignments. These balances occupy valuable balance-sheet capacity, face strict regulatory capital and liquidity constraints, and frequently necessitate daylight overdraft arrangements. Banks ultimately recover these capital and funding expenses through upfront fees and inflated exchange rates.
Third, Anti-Money Laundering and Countering the Financing of Terrorism (AML/CFT) regimes require comprehensive sanctions screening, customer due diligence (CDD), and automated transaction monitoring. Because these compliance checks are often duplicated independently by every bank along the correspondent chain, payment flows face administrative delays, inquiries for supporting documentation, or outright rejection and reversal.
2. FX Markups Across Eight Retail Wires
Granular, transaction-level cost disclosures for retail bank wires are virtually absent from public reporting. To shed light on actual practices, one of the co-authors compiled an empirical sample of eight international retail wire transfers executed through top-tier global institutions[1]:
| Date | Sending Currency | Receiving Currency | Sending Bank | Receiving Bank | FX Markup (bps) |
|---|---|---|---|---|---|
| 2024-11-18 | EUR | USD | Major German Bank | Major US Bank | 365.5 |
| 2025-06-26 | USD | EUR | Major US Bank | Regional French Bank | 230.2 |
| 2025-07-22 | EUR | SEK | Major US Bank | Major Nordic Bank | 198.6 |
| 2025-08-01 | EUR | USD | Major French Bank | Major US Bank | 457.8 |
| 2025-08-01 | EUR | USD | Major French Bank | Major US Bank | 467.8 |
| 2025-11-28 | CHF | USD | Major Swiss Bank | Major US Bank | 309.2 |
| 2026-01-06 | USD | EUR | Major US Bank | Regional German Bank | 299.5 |
| 2026-01-16 | SGD | USD | Major Singapore Bank | Major US Bank | 313.7 |
Source: Table 2 of the paper; exchange rate markups calculated relative to the Bloomberg New York 5:00 PM closing rate[1].
For wire transfers between the euro and the US dollar, exchange rate markups ranged from 230 to roughly 470 basis points; conversions involving the Swiss franc and Singapore dollar also exceeded 300 basis points. Because these figures isolate solely the margin embedded in the currency conversion and exclude explicit wire transfer fees, they represent an absolute lower bound for the total cost to the customer[1].
Compared against the wholesale market spread of under 6 basis points for EUR/USD, the retail markup charged by commercial banks is dozens of times higher.
3. The Authors'Assessment: Market Power
The sending institutions in this sample are large, global tier-1 commercial banks possessing direct access to wholesale interbank foreign exchange markets, vast proprietary correspondent networks, and ample multi-currency nostro balances. A substantial share of their settlement and liquidity overhead is internalized. Consequently, the authors argue that market access constraints and correspondent clearing expenses are insufficient to explain markups reaching hundreds of basis points; rather, the data reflects considerable pricing power wielded by incumbent commercial banks in retail currency exchange[1].
This finding is derived from a limited sample of eight individual transactions. The authors themselves characterize these observations as "anecdotal evidence" compiled to enhance transparency. Readers should interpret these figures as indicative evidence of market dynamics rather than an assertion that all international bank wires universally charge 3% to 4%.
4. Community Banks Renting Fintech Platforms
The same chapter introduces an instructive counterpoint. A US community bank without a proprietary international correspondent network routes its foreign exchange wire transfers through a third-party B2B fintech platform, which charges a flat USD 8 fee per transaction. The paper analyzes the historical wire records of this bank alongside an educational institution using the same infrastructure[1]:
- For Tier 1 currencies (GBP, EUR, JPY), the average foreign exchange markup was approximately 83 basis points;
- For Tier 2 currencies, markups averaged roughly 96 basis points, with the Hong Kong dollar and Singapore dollar trending higher at around 145 basis points;
- For Tier 3 currencies, markups averaged roughly 345 basis points, and Tier 4 averaged 322 basis points, exhibiting wide dispersion across specific currencies.
For major currencies, wires dispatched by the community bank via the fintech platform incurred markups between 80 and 100 basis points—dramatically lower than the 300+ basis points charged by large global banks. The authors interpret this as evidence that smaller depository institutions can pair local customer relationships with fintech payment rails, renting modern technology stacks to significantly lower the cost of international transfers[1]. For regional banks lacking the scale to maintain correspondent chains, this represents a viable operational model. Emerging market currencies, however, remain an exception: the platform applies conservative risk pricing to Tier 3 and Tier 4 currencies, resulting in quotes that are occasionally higher than retail MTO rates for small transfers.
5. Slowness in the Last Mile
International bank wires are traditionally stereotyped as requiring one to three business days (T+1 to T+3) to settle. Citing 2024 SWIFT operational data, the paper notes that approximately 90% of cross-border payment messages across the SWIFT network reach the beneficiary bank within one hour. The cross-border transit leg is typically rapid; the bulk of end-to-end friction and delay occurs during the "last mile," when the receiving institution must post funds to the end customer's ledger account following compliance verifications and internal batch cycles[1]. This aligns closely with previous analysis in this column; see Money Has Reached the Destination Country, Why Does It Still Take Hours? The Real Cross-Border Payment Bottleneck Is Shifting to the "Last Mile".
Initiatives such as SWIFT global payments innovation (gpi) and the adoption of ISO 20022 messaging standards have enhanced end-to-end payment transparency and enriched structured data payloads. Yet the authors observe that even with these operational enhancements, bank wires remain comparatively expensive, slow, and opaque relative to modern domestic instant payment rails[1]. The newly introduced Swift Payments Scheme addresses these structural gaps by mandating upfront fee and FX rate transparency; see Swift Payments Scheme: Why Cross-Border Payments Need a New Set of Rules. For the underlying architectural mechanics of messaging, see What Is ISO 20022? Understanding the Common Language of Next-Generation Payment Infrastructure.
3. Money Transfer Operators: Turning One Cross-Border Payment into Two Domestic Transfers
1. Prefunded Positions and Internal Netting
Non-bank fintech providers—such as Wise, Remitly, Revolut, Western Union, and MoneyGram—operate under money service business (MSB) or specialized payment institution licenses rather than full banking charters. They have re-engineered the correspondent model without eliminating its underlying banking foundation[1].
Their core innovation centers on establishing local-currency accounts across multiple jurisdictions through commercial banking partners and prefunding those accounts with working capital. When a sender in Country A initiates a transfer to Country B, the MTO collects funds domestically in Country A and instructs its partner bank in Country B to disburse funds locally from its prefunded reserves. At the precise moment the customer sends money, zero capital crosses international borders. Opposing customer flows within the MTO's network are netted internally; only residual structural imbalances require settlement via wholesale foreign exchange markets or cross-border commercial bank wires. Combined with automated digital onboarding, digital Know Your Customer (KYC) workflows, and scalable operational architectures, marginal processing costs fall significantly. In terms of consumer pricing, MTOs generally display a transparent flat fee and a guaranteed conversion rate upfront before payment execution[1].
2. How the Ledger Entries Change
Revisiting the introductory USD 10,000 tuition transfer illustrates the balance-sheet dynamics. Assuming the MTO maintains banking relationships in the United States and Germany, with a simplified baseline exchange rate of USD 1 = EUR 0.87 (excluding fees for illustration):
| Step | US Side (USD) | Euro Area Side (EUR) |
|---|---|---|
| Pre-transfer | MTO account at US partner bank: existing working balance | MTO account at German partner bank: prefunded EUR 500,000 |
| Sender pays in | Parent deposit −10,000; MTO account +10,000 | No change |
| MTO disburses payout | No change | MTO account −8,700; Student account +8,700 |
| Post-transfer | MTO US dollar position increases | MTO euro position decreases |
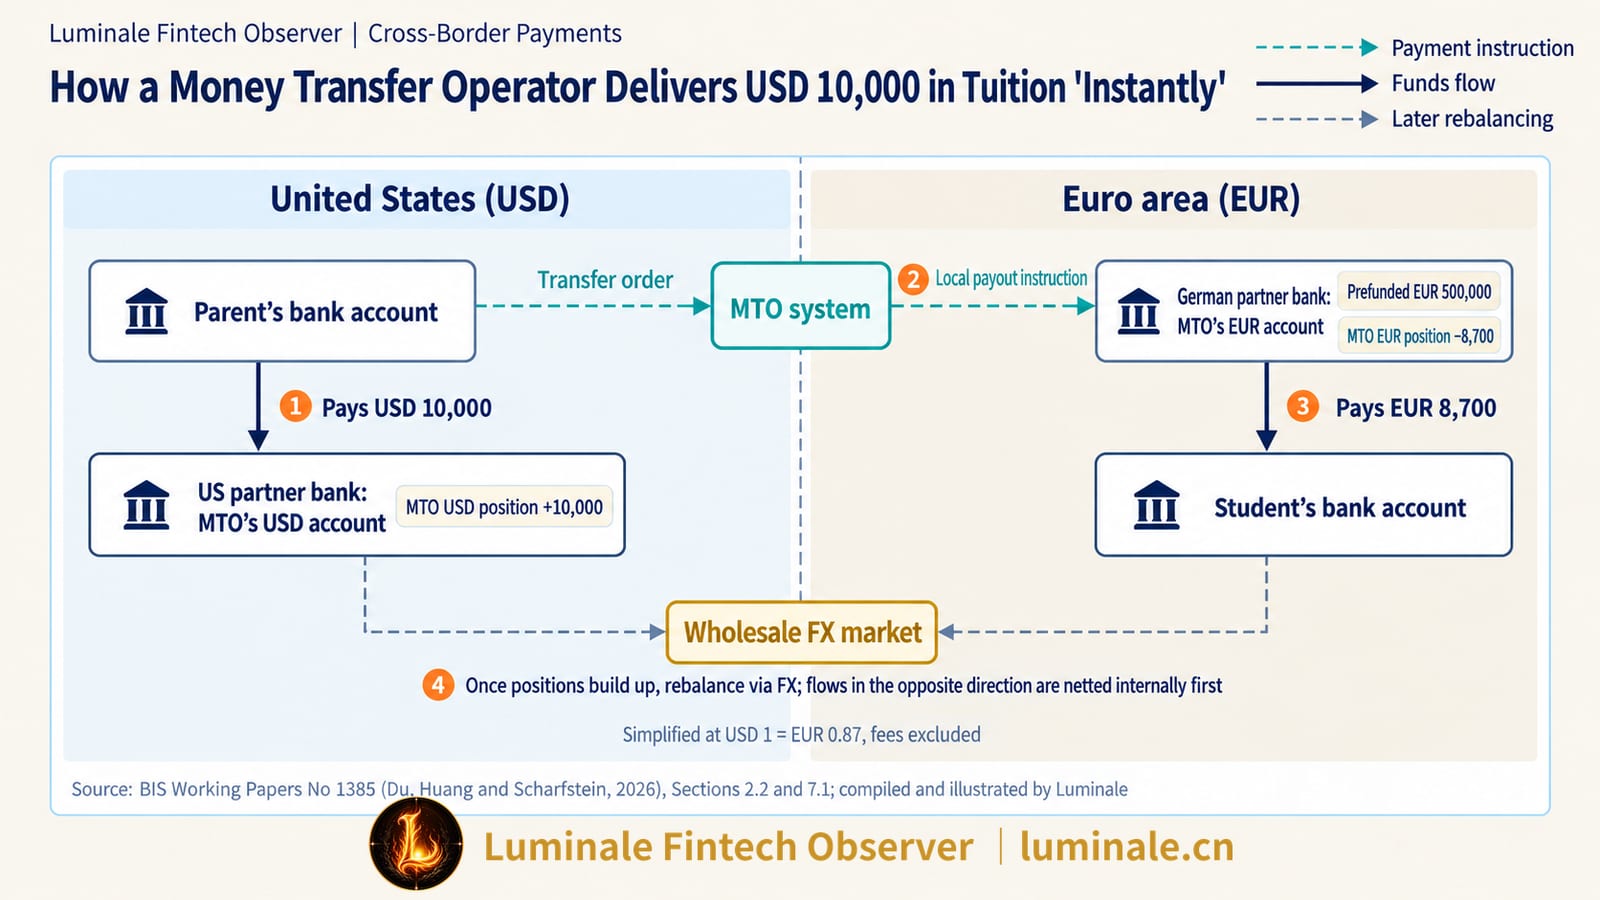
The sensation of instantaneous cross-border delivery experienced by the user is made possible by the liquidity the MTO stationed in the receiving jurisdiction beforehand. The authors emphasize that settlement is achieved through pre-positioned liquidity and internal netting; underlying funds do not move across borders during the customer transaction itself[1].
Customer balances entrusted to an MTO reside in segregated custodial accounts held at regulated commercial partner banks. This framework parallels statutory customer safeguarding requirements applied to domestic payment institutions; see Is Money in Alipay the Same as Money in a Bank Account? A Clear Explanation of Customer Reserve Funds.
3. Costs Fall as Transfer Amounts Rise
Table 3 of the paper compiles scraped pricing quotes across three leading MTOs for outbound transfers from the United States (sampled every 30 minutes between January 23 and May 3, 2026, selecting the lowest-cost pay-in and pay-out method for each corridor); Figure 1 plots median costs by currency tier based on data from the week of January 23–30[1].
| Receiving Currency | Tier | USD 200 | USD 500 | USD 10,000 | USD 50,000 |
|---|---|---|---|---|---|
| EUR | 1 | 174.9 | 101.5 | 39.2 | 39.3 |
| GBP | 1 | 194.2 | 153.7 | 41.1 | 38.6 |
| JPY | 1 | 262.0 | 213.1 | 107.0 | 116.9 |
| CAD | 2 | 217.1 | 176.7 | 37.8 | 33.6 |
| CHF | 2 | 243.9 | 194.9 | 146.8 | 140.6 |
| HKD | 2 | 213.2 | 177.5 | 121.7 | 120.8 |
| INR | 3 | 212.6 | 109.5 | 26.0 | 26.7 |
| CNY | 3 | 200.5 | 166.5 | 94.6 | 80.0 |
| MXN | 3 | 292.0 | 200.3 | 76.8 | 69.7 |
| PHP | 4 | 227.3 | 198.8 | 152.1 | 155.4 |
| PEN | 4 | 486.5 | 346.7 | 254.2 | 237.4 |
| NGN | 4 | 85.6 | 57.2 | −16.6 | −9.6 |
Median all-in cost in basis points, excerpted from Table 3 of the paper[1].
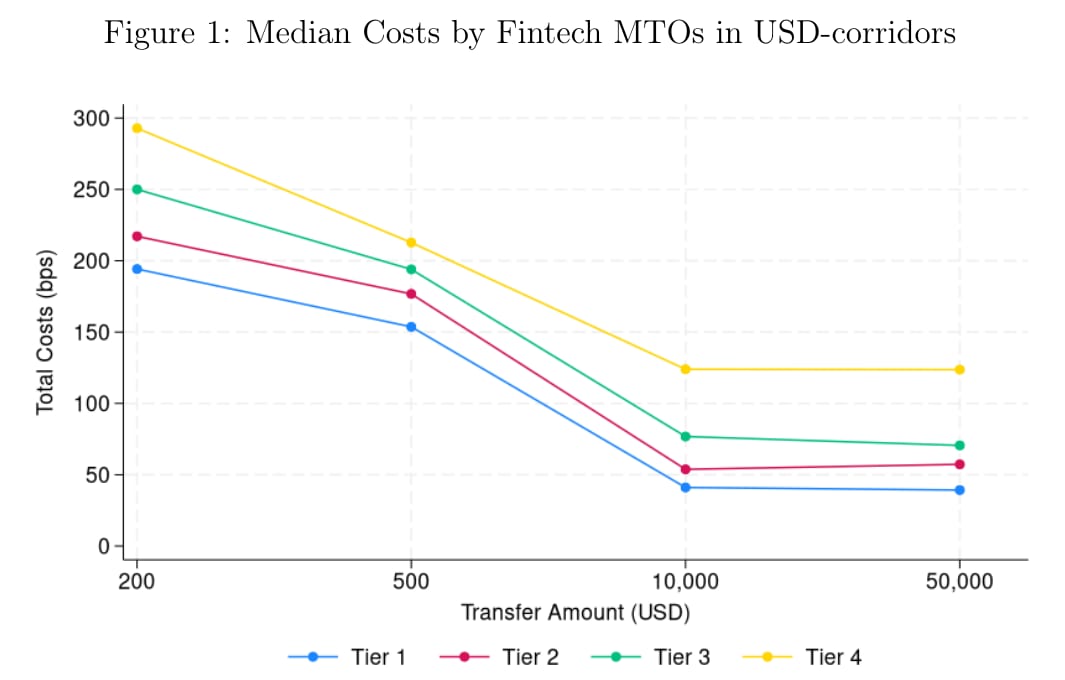
For a modest USD 200 remittance, median all-in costs range from approximately 200 basis points for Tier 1 currencies to nearly 300 basis points for Tier 4. When the transfer size reaches USD 10,000, costs for Tier 1 and Tier 2 currencies collapse to around 40–60 basis points, while Tier 3 and Tier 4 decline to roughly 80–130 basis points. Beyond USD 10,000, all-in costs plateau. The authors explain this dynamic through the presence of fixed fees: on a USD 200 transfer, a fixed fee of several dollars contributes more than 100 basis points to the total, whereas on a USD 10,000 transfer, its impact becomes negligible[1].
For the parent remitting USD 10,000 to the euro area via an MTO app, the median cost of approximately 39 basis points amounts to roughly USD 39—an order of magnitude below the currency markups charged by major commercial banks.
4. Cost Disparities Across Currencies
While larger transfer volumes compress percentage costs, cross-currency disparities persist. For a USD 50,000 transfer, the median cost for Tier 4 currencies remains roughly triple that of Tier 1. The Japanese yen is visibly more expensive than other Tier 1 currencies, while the Swiss franc and Hong Kong dollar hold around 120–150 basis points even at the USD 10,000 mark. Emerging market currencies diverge even more sharply: the Indian rupee and Indonesian rupiah support highly competitive rates for large transactions (approximately 26 and 74 basis points at USD 10,000, respectively), whereas the Polish zloty, Philippine peso, and several Latin American currencies remain above 150–250 basis points even at high values[1].
The authors observe that because MTOs still rely on regulated commercial partner banks and wholesale FX markets to clear residual inventory, structural cost differentials across currency tiers cannot be eliminated entirely[1]. The degree to which an MTO can bypass correspondent banking friction varies across corridors, dictated by local capital control regimes, domestic payment infrastructure maturity, and the ease of maintaining corporate bank accounts in the host jurisdiction.
5. How Negative Costs Arise
The empirical data features an intriguing anomaly: outbound transfers of USD 10,000 to Nigeria registered a median all-in cost of −16.6 basis points, with certain brackets for the Argentine peso also turning negative. The authors attribute this to parallel market exchange rates created by strict capital controls. In jurisdictions where capital account restrictions constrain outbound foreign currency flows, residents are willing to pay an exchange premium to obtain foreign balances abroad. When MTOs channel inbound remittances into these economies, they can secure local currency at rates substantially more favorable than official central bank benchmarks[1].
4. The Stablecoin Sandwich: Nearly Free on Chain, Re-Monetized at Both Ends
1. Four Cost Components
Stablecoins are frequently promoted as the ultimate cross-border payment vehicle: instantaneous, borderless, and practically free. The authors dissect the all-in cost of a stablecoin remittance into four distinct components[1]:
- Foreign exchange conversion costs between fiat currencies and stablecoins;
- Trading commissions levied by cryptocurrency exchanges;
- On-chain network transaction fees (gas) incurred to transfer stablecoins across the blockchain;
- Fiat on-ramp and off-ramp fees, including fiat deposit and withdrawal charges imposed by banking partners or exchanges.
For foundational concepts regarding stablecoin pegging mechanics and collateral architectures, see Understanding Stablecoins in One Article: How Do They Actually Stay "Stable"?.
2. A USD 100 Single-Layer Sandwich
Figure 2 of the paper traces a concrete workflow: Sender A in the United States deposits USD via ACH to Coinbase, purchases USDC, transfers it across Ethereum to Recipient B, who sells the USDC for euros on Kraken and withdraws the fiat balance into a euro area bank account[1].
| Step | Location | Fee | Balance After Action |
|---|---|---|---|
| Sender deposits USD via ACH | US Banking System → Coinbase | 0 | Coinbase Account: USD 100 |
| Purchases USDC | Coinbase | 0 (in the paper's example) | 100 USDC |
| Transfers USDC on Ethereum to B's Kraken account | Ethereum Blockchain | Gas: ~USD 0.19; Kraken deposit: 0 | 99.81 USDC |
| Sells USDC for EUR | Kraken | 1% trading fee, plus exchange FX spread vs. Bloomberg benchmark | ~98.8 USDC converted into EUR at exchange quote |
| Withdraws EUR via Single Euro Payments Area (SEPA) | Kraken → Euro Area Banking System | EUR 1 withdrawal fee | Preceding EUR amount minus EUR 1 |
Source: Figure 2 of the paper[1].
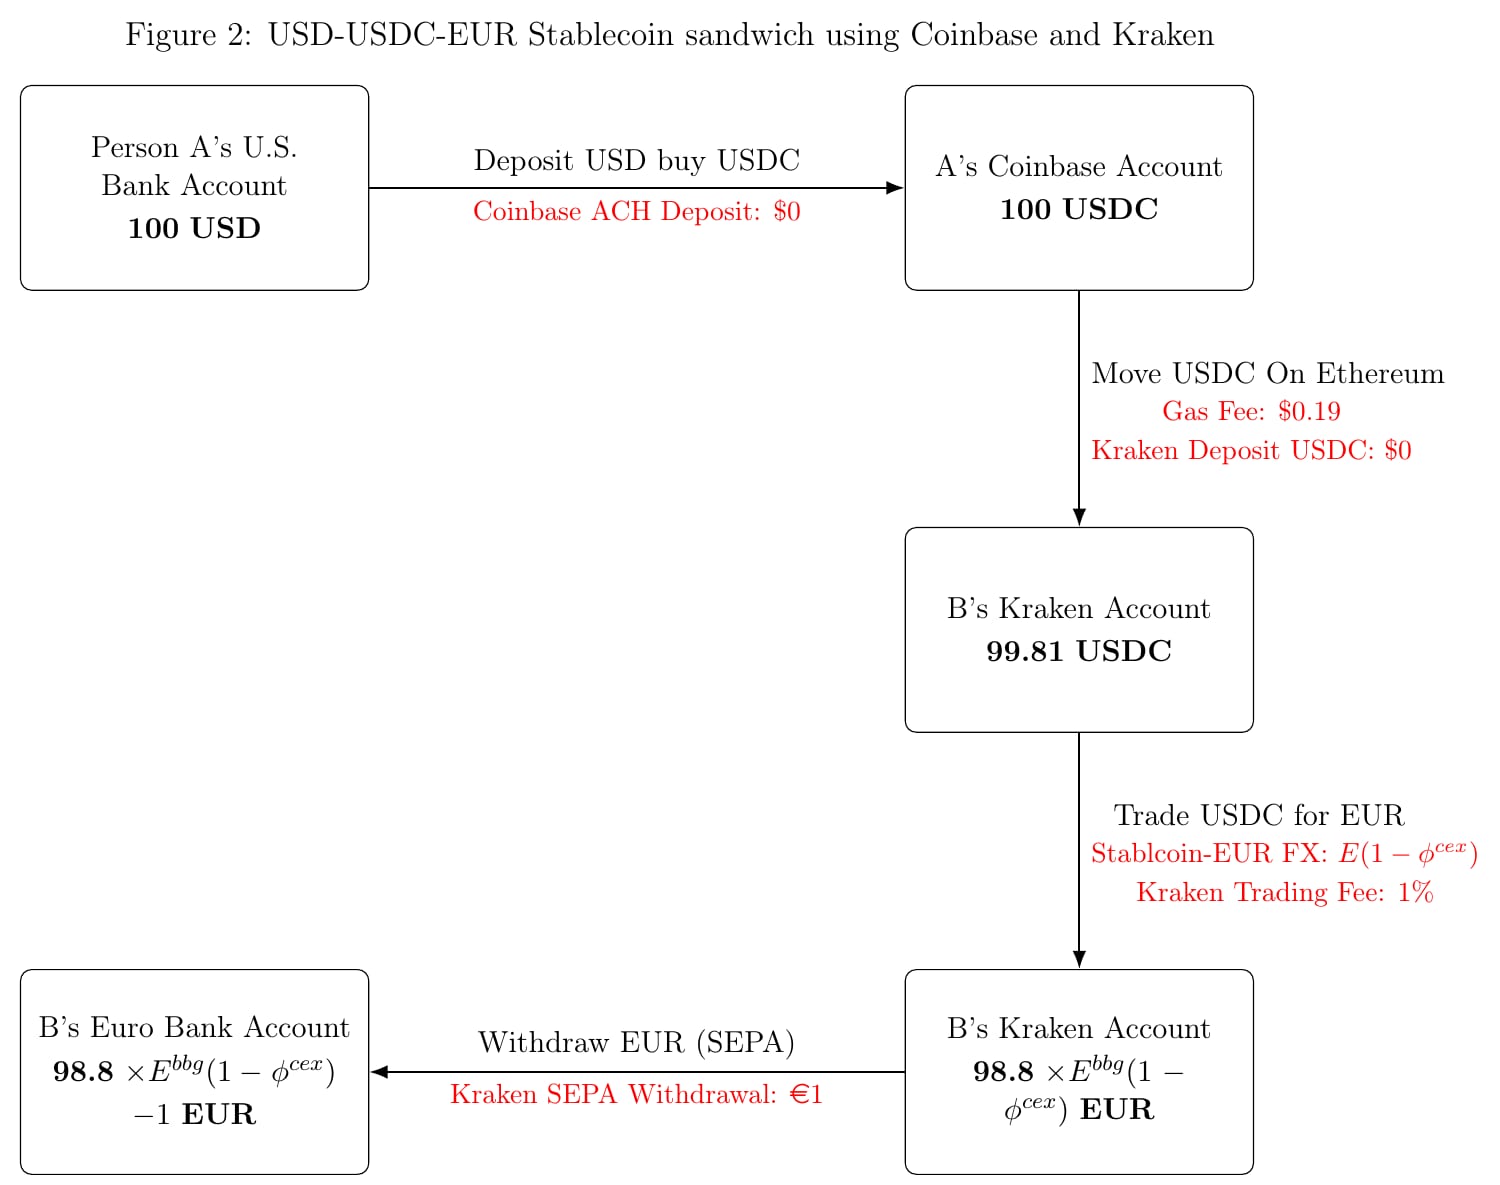
The actual on-chain transaction cost just USD 0.19. The bulk of the expense was concentrated at Kraken: a 1% trading commission, plus a flat EUR 1 SEPA withdrawal fee, which on a USD 100 transfer adds more than another full percentage point. Even if the exchange quote matched the Bloomberg benchmark perfectly, the all-in cost of this USD 100 remittance exceeds 2%. Expanding the transfer to USD 10,000 diminishes the relative drag of gas and withdrawal fees, leaving the 1% trading fee as the dominant cost center. In his conference discussion, Adrian summarizes the baseline empirical evidence from this corridor as representing an all-in cost of approximately 150 basis points[2]. The authors note further that this baseline excludes potential token withdrawal fees from the sending exchange and cross-chain bridge fees if assets transition between blockchains[1].
3. The Scale of Each Fee Component
On-chain execution is undeniably inexpensive. Table 8 of the paper evaluates average median daily transaction fees across major networks between April 2023 and April 2026: Ethereum averaged approximately USD 1.50, Tron averaged USD 0.06, BNB Chain averaged USD 0.03, while Arbitrum and Base (two major Ethereum Layer 2 networks) each averaged roughly USD 0.04[1]. Relative to international remittance amounts of hundreds or thousands of dollars, network gas is negligible.
Centralized exchange fees, however, are substantial. Table 9 indicates that across five of the six major exchanges surveyed, spot trading commissions span 0 to 60 basis points, with lower maker fees and higher taker fees; Kraken charges a flat 1% to retail users trading under USD 10,000 per month. While fiat deposits are frequently free or low-cost, fiat withdrawals often carry flat charges: Coinbase levies a USD 25 wire fee for US dollar withdrawals, and Kraken charges EUR 1 for SEPA euro payouts[1]. The presence of flat withdrawal charges means stablecoin channels exhibit the exact same economies of scale as MTOs: smaller transfer amounts face disproportionately heavy percentage burdens.
4. A Double-Layer Sandwich with Two Stablecoins
Where a euro-denominated stablecoin is accessible, currency conversion can be migrated directly onto the blockchain. Figure 3 of the paper diagrams this sequence: USD → USDC → decentralized exchange (Uniswap) swap into EURC → fiat euro withdrawal[1].
Decentralized exchanges do not feature traditional market maker quotes; prices are formed algorithmically via Automated Market Maker (AMM) liquidity pools. Under the standard constant-product formula, a liquidity pool holds reserves of USDC and EURC, with the exchange rate defined by the ratio of the two token balances. When a trader exchanges USDC for EURC, the reserve ratio shifts, altering the price until arbitrageurs realign on-chain rates with wholesale off-chain benchmarks[1]. DEX operations and AMM mechanics rely entirely on smart contract execution; see Smart Contracts, Programmability, and On-Chain Settlement: Foundations of Financial Transaction Automation.
The fee stack for this route comprises[1]:
- Gas fees across three transactions (transferring USDC from Coinbase to a self-custodial wallet, swapping on Uniswap, and forwarding EURC to Kraken), totaling roughly USD 0.60 on Ethereum;
- The Uniswap protocol fee, modeled at 0.05% of the transaction volume;
- Kraken's flat EUR 1 SEPA withdrawal fee.
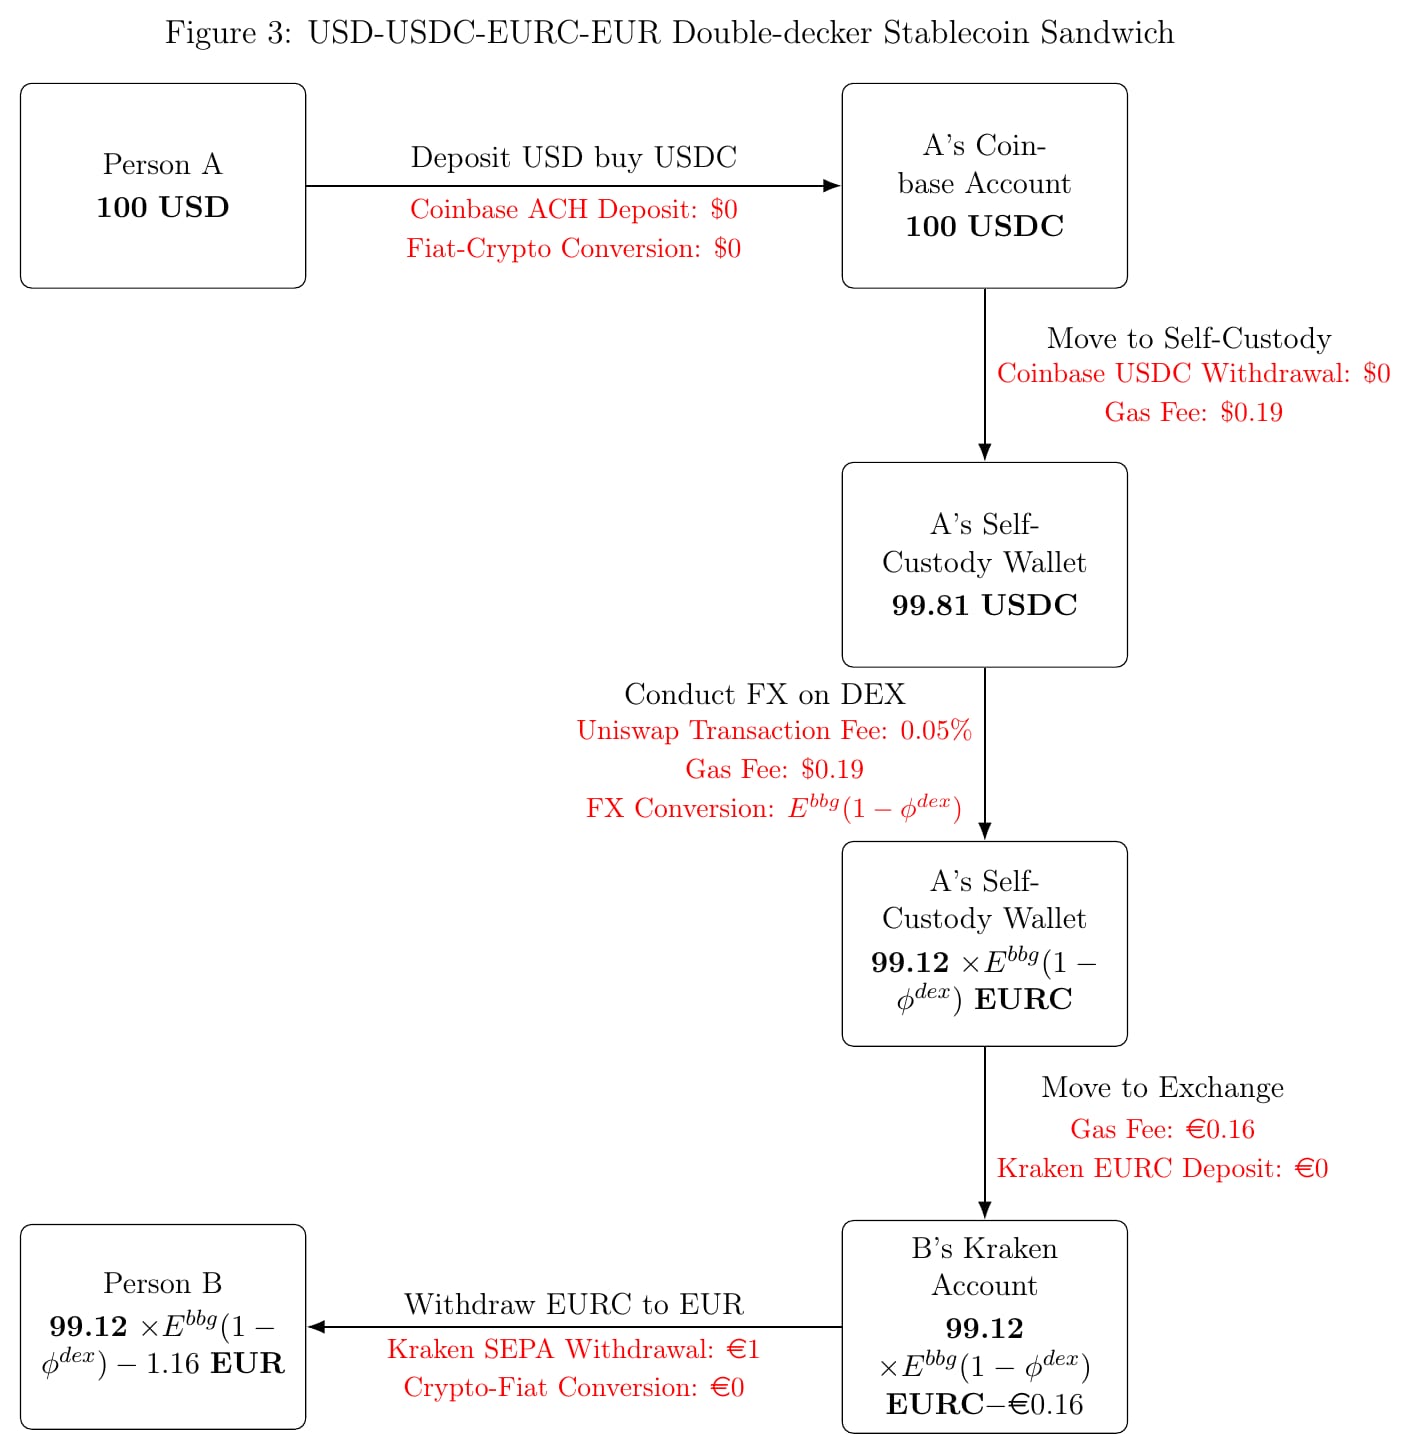
The AMM protocol fee is substantially lower than Kraken's 1% centralized trading fee. The operational challenge, however, is that decentralized exchanges do not perform AML or KYC checks and possess no banking integration; fiat on-ramps and off-ramps must still rely on centralized exchanges, crypto-friendly commercial banks, or specialized gateways such as MoonPay, Transak, or Banxa[1]. Users must also maintain balances of native blockchain tokens (such as Ether) to pay network gas; for the legal and economic nature of unbacked cryptoassets, see What Are Cryptoassets? The Financial Logic of Bitcoin, Ether, and Unbacked Cryptoassets.
The authors conclude that while the double-layer sandwich decentralizes currency price discovery, intermediation has not disappeared: moving between fiat and digital tokens remains bound to centralized entities[1].
5. Exchanges Acting as Correspondent Banks
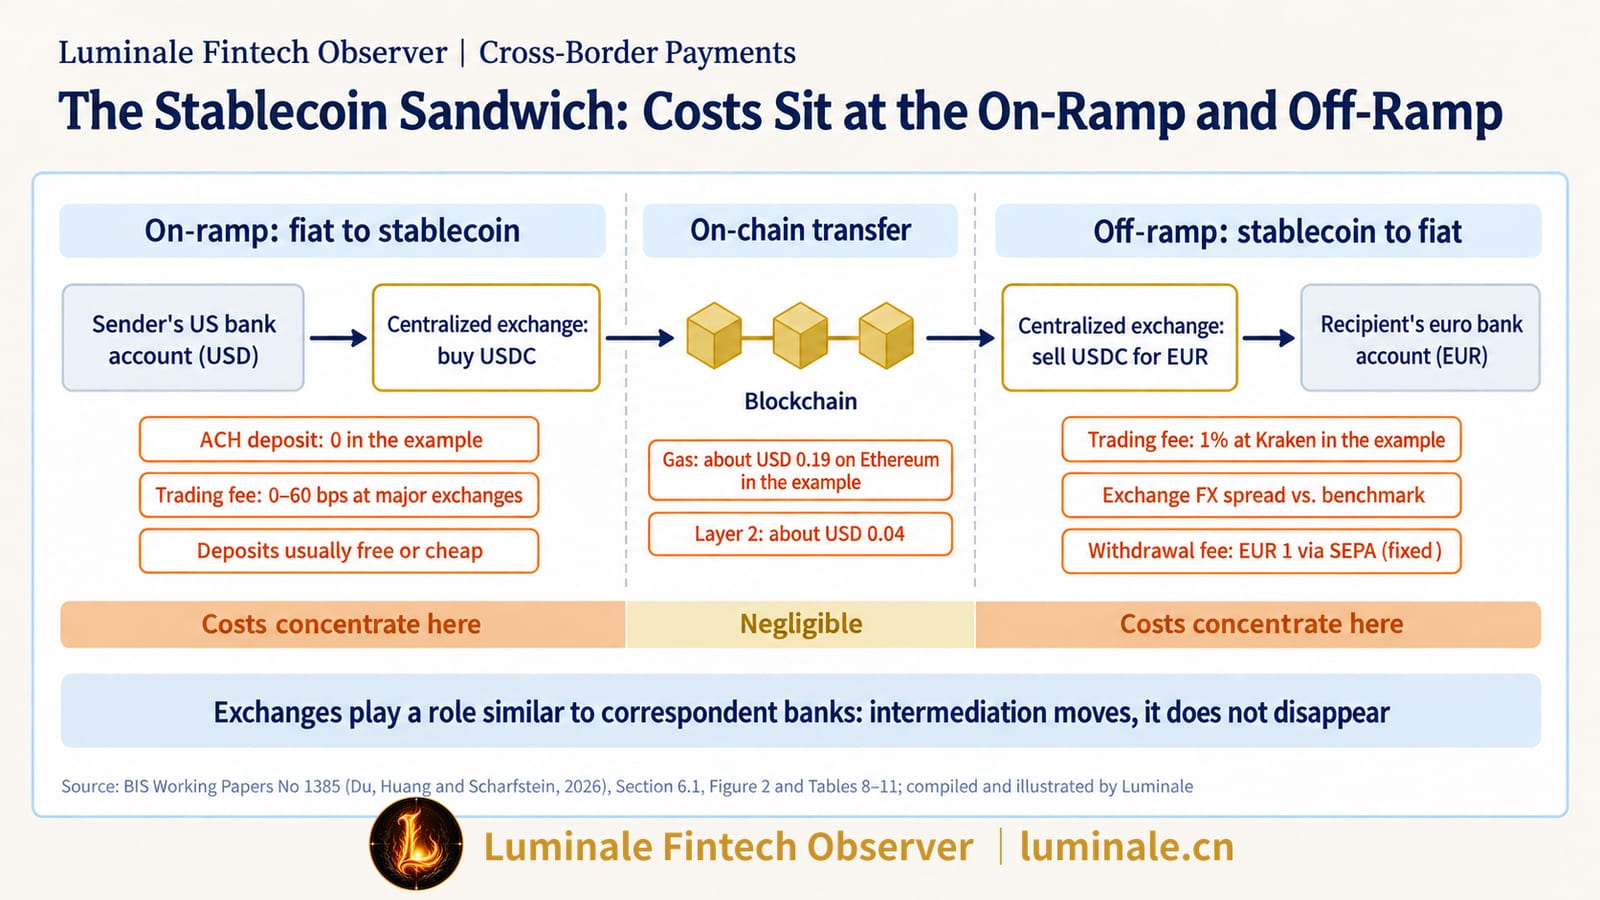
Comparing both implementations demonstrates that on-chain token transit is extraordinarily cheap. However, costs cluster heavily at the edges: the fiat-to-stablecoin entry point and the stablecoin-to-fiat exit point.
The authors observe that the stablecoin sandwich is far from disintermediated or frictionless. Centralized crypto exchanges function essentially as correspondent banks, introducing new intermediary layers into a payment rail frequently heralded as disintermediated. Even if users avoid centralized exchanges, peer-to-peer matching platforms, fintech gateways, or crypto-focused banks must perform analogous functions[1]. The stablecoin rail simply substitutes one set of intermediaries for another.
6. The FX Leg: Major Currencies Approach Wholesale Rates
When pricing major currency pairs against fiat, stablecoins demonstrate strong efficiency. Based on transaction microdata from centralized exchanges in Table 5, the foreign exchange margin for Tier 1 and Tier 2 currencies averaged near zero, with minimal price deviations recorded for the euro, British pound, Swiss franc, and Singapore dollar[1]. Where liquidity is abundant, the currency conversion leg of a stablecoin sandwich can execute at rates closely tracking the wholesale market.
The on-chain double-layer sandwich yields similar results. Table 12 reveals that on decentralized exchanges, exchange rates between dollar stablecoins and EUR, GBP, CHF, or SGD stablecoins closely align with Bloomberg mid-market quotes[1].
7. Negative Costs in Emerging Markets Stem from Capital Controls
The landscape for Tier 3 and Tier 4 emerging market currencies is fundamentally different. For many developing currencies, the stablecoin conversion cost was negative—meaning that when remitting outbound from the US, the effective exchange rate obtained via stablecoins was superior to the official Bloomberg benchmark[1]:
| Currency | 2021–2024 Average (bps) | 2025–2026 Average (bps) |
|---|---|---|
| Indian Rupee (INR) | −548.5 | −289.0 |
| South Korean Won (KRW) | −190.7 | −107.7 |
| South African Rand (ZAR) | −188.3 | −88.9 |
| Brazilian Real (BRL) | −61.3 | −19.0 |
| Nigerian Naira (NGN) | −1,746.8 | −129.9 |
| Argentine Peso (ARS) | −6,267.0 | −477.9 |
Source: Table 5 of the paper, based on centralized exchange execution data for USDT/USDC against local fiat[1].
The paper terms this phenomenon the "stablecoin premium": in jurisdictions with strict capital account controls, local residents are willing to pay a premium to obtain stablecoins (and thereby acquire synthetic US dollar exposure). Consequently, converting stablecoins into local currency yields a favorable rate. The authors state unequivocally that stablecoin channels achieve lower costs in these corridors largely because they operate partially outside conventional capital account restrictions; this price advantage is the byproduct of capital control distortions rather than superior technological efficiency[1]. This matches earlier empirical findings regarding the "Bitcoin premium." For structural differences between current and capital account flows and how cross-border controls operate, see From Current Account to Capital Account: How Cross-Border Capital Is Classified.
The authors cross-reference this dynamic against World Bank RPW data: between Q1 2022 and Q3 2025, across 12 high-cost outbound US remittance corridors, the average RPW all-in cost stood at 411 basis points, whereas the concurrent stablecoin FX conversion margin averaged −124 basis points[1]. Measurement discrepancies in this comparison are addressed in Section 5.
Table 5 also illustrates that these premiums narrowed sharply between 2025 and 2026. The premium for the Argentine peso shrank from −6,267 basis points to −478 basis points, while the Nigerian naira contracted from −1,747 to −130 basis points. In his discussion, Adrian questions whether this pricing advantage is structural or transitory, and how long it can endure as crypto liquidity deepens[2].
8. Market Depth Cannot Support Large-Value Payments
While headline conversion rates appear attractive, executable market depth remains remarkably shallow. On centralized exchanges, the most liquid pair—US dollar stablecoins against the euro—averaged daily turnover of roughly USD 186 million between 2021 and 2025. In the traditional wholesale foreign exchange market, daily euro-related turnover reached approximately USD 2.7 trillion over the same period. Beyond the euro, only five currencies registered average daily stablecoin turnover exceeding USD 10 million: the South Korean won, Turkish lira, Brazilian real, British pound, and Thai baht[1]. On decentralized exchanges, meaningful liquidity exists almost exclusively between USD and EUR stablecoins (averaging roughly USD 15 million daily), while volumes in non-USD stablecoin pairs are virtually negligible[1].
Thin liquidity introduces two critical vulnerabilities. First, exchange rates exhibit acute volatility: standard deviations of FX conversion margins in Table 5 span hundreds or even thousands of basis points. Second, large transactions move the order book, creating severe price slippage. The authors conclude that while stablecoin rails may compete effectively for retail-sized transfers, they cannot currently displace traditional payment channels for high-value corporate or institutional treasury flows[1].
9. Minutes on Chain, but Converting Back to Bank Deposits Takes Time
While stablecoins travel across a public blockchain in minutes, true end-to-end processing speed is governed by the operational responsiveness of banking gateways at both ends. The authors cite Circle's redemption mechanics: standard USDC redemptions settle on a T+1 basis without fee penalties; however, if an institutional client requires same-day (T+0) cash settlement in US dollars, Circle levies an expedited processing charge[1]. However fast on-chain consensus occurs, transforming digital tokens into usable commercial bank deposits instantly still demands payment for liquidity provision. This friction mirrors the redemption lag highlighted in international regulatory assessments; see Tokens Move Around the Clock, Redemptions Still Wait for Markets to Open: Reading the FSB Note on Cross-border Risks of Global Stablecoins.
10. Trust, User Experience, and the Final Settlement Asset
Traditional bank wires are anchored in mature legal and regulatory architectures featuring deposit insurance guarantees and enforceable institutional recourse. MTOs operate as licensed entities relying on regulated commercial banks for fund segregation and final payout. Stablecoin rails, by contrast, depend on the ongoing solvency of private token issuers, the operational resilience of centralized exchanges, and still-crystallizing regulatory frameworks. The paper highlights historical systemic disruptions, including the collapse of FTX, the temporary de-pegging of USDC during the Silicon Valley Bank failure, and persistent market skepticism surrounding USDT reserve transparency[1]. At the time the working paper was drafted, the US Guiding and Establishing National Innovation for U.S. Stablecoins Act (GENIUS Act) was referenced as proposed legislation; that bill was subsequently enacted into law on July 18, 2025, as Public Law 119-27[3].
For ordinary consumers, the stablecoin channel presents substantial usability hurdles. Senders must maintain verified exchange accounts, manage self-custodial wallets, hold native tokens to pay network gas, navigate conflicting token standards and wallet compatibility, and occasionally execute cross-chain bridge transactions. Blockchain transactions are fundamentally irrevocable; transferring funds to an erroneous address or network can result in permanent asset loss[1].
The authors suggest that the future of stablecoins in remittances lies in fintechs abstracting tokens into the back office. US-based remittance provider Felix Pago enables US customers to send funds to family members in Latin America via WhatsApp. Along the US-Mexico corridor, the platform executes an internal sandwich between USD, USDC, and Mexican pesos in the background, presenting the user with an intuitive messaging interface[1].
From the perspective of monetary economics, stablecoins moving on chain represent private claims on non-bank issuers; they are neither central bank reserves nor insured commercial bank deposits. The euro payout ultimately received by the beneficiary is an ordinary commercial bank credit originated by the exchange's banking partner. The differing credit quality of these settlement assets sits at the heart of the BIS debate on the "singleness of money"; see Why Is One Yuan from Any Bank Still One Yuan, but a Stablecoin May Not Be? Understanding the BIS Idea of the Singleness of Money. Furthermore, cryptographic confirmation on a distributed ledger is distinct from statutory settlement finality under civil law; see Can a "Successful Payment" Be Reversed? What Risks Does Settlement Finality Solve?.
5. Aligning Measurement Standards Before Comparing Rails
1. Measurement Discrepancies Highlighted by the IMF Discussion
In his formal discussion, Adrian endorses the conceptual validity of the all-in cost framework but notes that empirical execution across the paper does not apply fully symmetric measurement standards to all three rails[2]:
- Bank wire calculations evaluate only FX markups, omitting explicit wire transfer fees;
- MTO calculations capture full all-in costs, incorporating both flat fees and exchange rates;
- Stablecoin costs are presented across separate tables rather than aggregated into a single end-to-end total;
- Table 6 contrasts the partial FX conversion margin of stablecoins directly against the full all-in cost reported by World Bank RPW data.
Sample compositions also diverge: corridors, observation windows, and transfer sizes vary across tables. Adrian recommends comparing payment rails across matched corridors, identical time windows, and uniform transaction amounts under a standardized cost definition, isolating true rail efficiency from sampling artifacts[2].
For researchers and practitioners, the paper's findings provide directional clarity and magnitude benchmarks rather than an off-the-shelf, direct pricing menu across channels.
2. Another IMF Study: Stablecoins Are Cheaper on Average, but Not Always
Adrian highlights forthcoming IMF research (Reslow et al., Deconstructing the Stablecoin Sandwich: The Cost of Cross-Border Stablecoin Transfers). That study manually gathered disclosures across 18 countries, 29 exchanges, and 270 corridors, spanning multiple stablecoins and blockchains, and disaggregated a stablecoin sandwich into ten discrete fee components[2].
Key findings include[2]:
- The average cost of a USD 200 cross-border transfer was approximately 2.2%, exhibiting wide corridor dispersion ranging from −2% to +8%;
- In terms of cost breakdown, fiat payment gateways accounted for roughly 0.67%, trading commissions represented 0.85%, and on-chain blockchain gas contributed 0.48%—confirming that off-chain fiat interfaces dominate total costs;
- Corridor dispersion was driven primarily by foreign exchange conversion margins (the crypto premium), with directional asymmetries depending on the flow of funds;
- On corridors matching World Bank RPW benchmarks, stablecoin transfers averaged ~1.0% versus ~5.8% for traditional RPW channels;
- However, in roughly one-third of surveyed corridors, the most competitive traditional channel was cheaper than the cheapest available stablecoin route.
These findings corroborate the core thesis of the BIS paper: on-chain transit contributes minimally to total expenses, while fiat on/off-ramps and exchange trading dominate. They also demonstrate that aggregate averages mask substantial cross-corridor variance.
3. The Impact of Stablecoin Flows on FX Markets
Adrian further references IMF Working Paper 2026/056 (Aldasoro, Beltran, and Grinberg, Stablecoin Inflows and Spillovers to FX Markets). Examining five years of daily data across 64 centralized exchanges, 4 major dollar stablecoins, and 25 fiat currencies, the authors find that a 1% increase in net stablecoin inflows correlates with a ~40 bps widening in stablecoin peg deviation, a ~5 bps domestic currency depreciation, and a ~5 bps expansion in covered interest parity (CIP) deviations[2][4].
The proposed transmission channel operates through balance-sheet-constrained intermediaries. Entities active in both stablecoin markets and FX swap intermediation face balance sheet limits; expanding stablecoin positions absorbs regulatory capacity and crowds out synthetic dollar funding provision[2]. While these empirical estimates reflect specific sample conditions, they emphasize that evaluating stablecoin payment rails requires analyzing broader linkages with domestic currency stability and dollar funding markets—a dimension particularly vital for emerging economies.
4. Moving the Money Is the Cheapest Part of the Service
Section 7.6 of the paper reviews unit-cost data provided by Wise for a representative GBP-to-EUR cross-border transfer[1]:
| Cost Element | Fixed Component | Variable Component (% of volume) |
|---|---|---|
| Customer Support | GBP 0.11 | 0.01% |
| Compliance (AML, Fraud, KYC, Sanctions Screening) | GBP 0.06 | 0.01% |
| Other Operations | GBP 0.05 | 0.01% |
| Payment Rail (Bank Fees, Treasury Rebalancing, FX) | GBP 0.02 | 0.03% |
| Total Marginal Cost per Transfer | GBP 0.24 | 0.06% |
Source: Table 14 of the paper, provided by Wise[1].
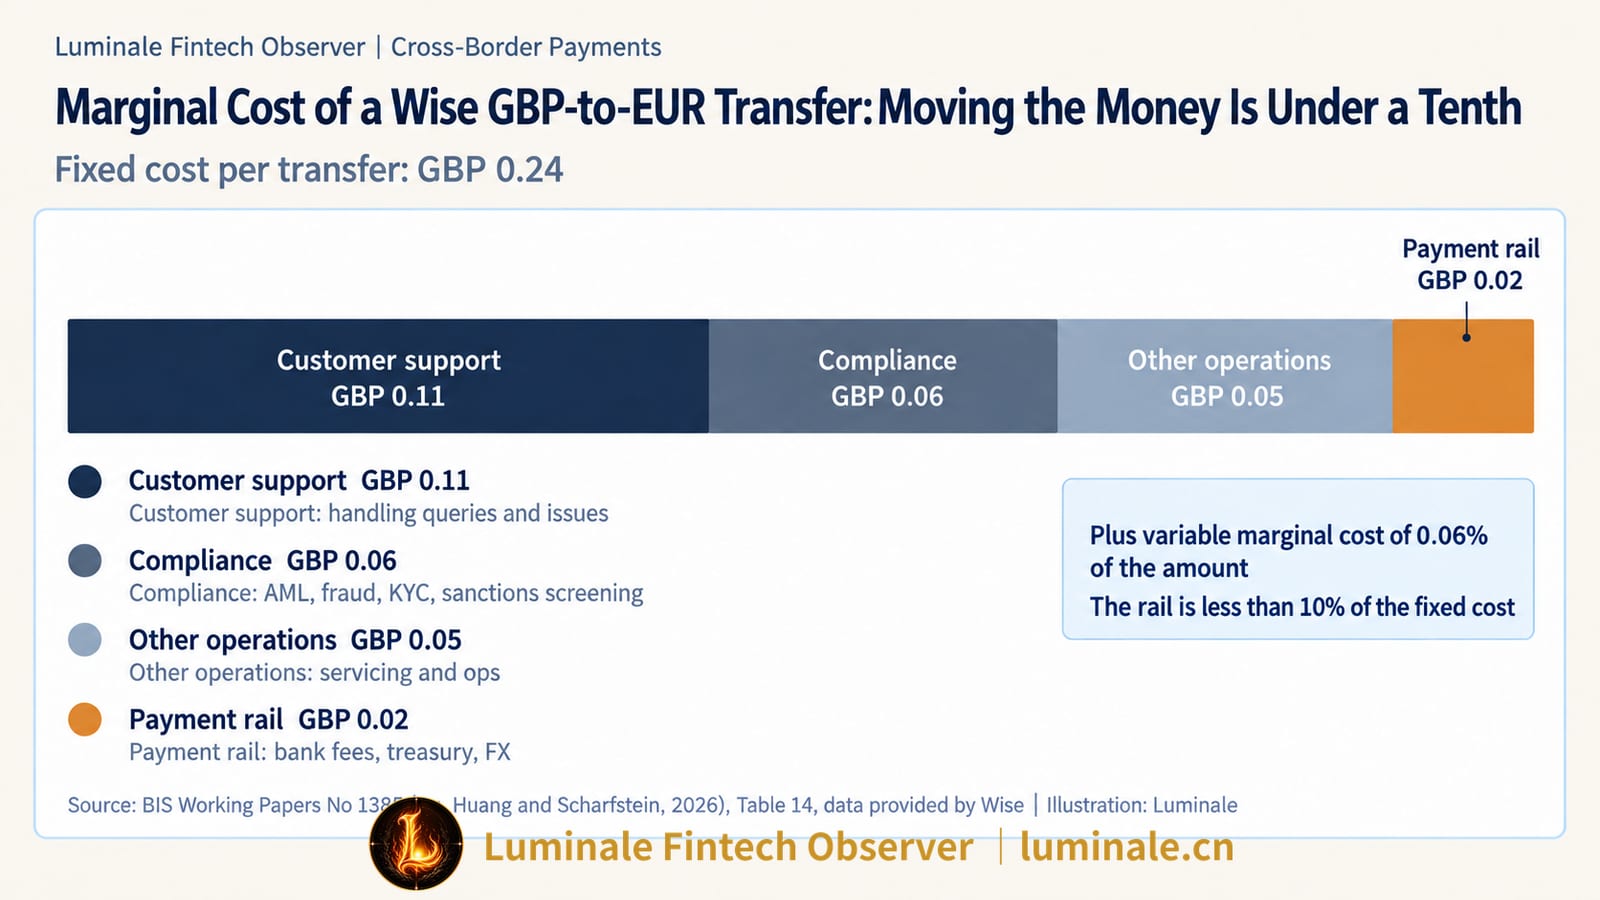
Within the fixed marginal cost of GBP 0.24 per transfer, customer service accounts for GBP 0.11, compliance represents GBP 0.06, while the actual payment rail—bank charges, treasury movements, and FX execution—totals a mere GBP 0.02, or less than a tenth of the total. The authors deduce that moving funds across a payment rail is among the least expensive components of an international remittance; customer support and compliance constitute the dominant overhead, and these two cost centers are precisely what informal stablecoin estimates routinely omit[1].
Even if blockchain technology compressed rail costs to zero, an institution operating under full regulatory compliance and providing human customer support could not eliminate the vast majority of its fixed operating expenses.
5. Alternative Architectural Paths
Section 7.7 of the paper surveys emerging initiatives seeking to transform global cross-border architecture[1]. Under the analytical framework developed by Luminale, these models can be classified across four structural categories based on their ultimate settlement asset:
| Approach | Examples | Settlement Asset | Architectural Characteristics |
|---|---|---|---|
| Commercial Bank Money on Chain | J.P. Morgan Kinexys tokenized deposits | Commercial bank deposits | 24/7 transfers on permissioned ledgers; supports conditional payments and Delivery versus Payment (DvP) |
| Tokenized Central Bank Money | Fnality | Central bank reserves held in omnibus accounts | Tailored for wholesale financial markets; targets 24/7 atomic settlement |
| Interlinked Fast Payment Systems (FPS) | BIS Innovation Hub Nexus; bilateral links between Singapore and Thailand, Malaysia, India, Indonesia | Commercial bank deposits within domestic FPS rails; creates no new monetary asset | Real-time retail payments executed via mobile phone numbers or standardized QR codes |
| Multilateral Wholesale CBDC Platforms | Project mBridge | Wholesale central bank digital currencies issued by participating central banks | Simultaneous, multi-currency Payment versus Payment (PvP) on a shared distributed ledger |
Source: Compiled based on Section 7.7 of the paper[1].
Singapore has operationalized real-time payment linkages between PayNow and Thailand's PromptPay (2021), Malaysia's DuitNow (2023), and India's Unified Payments Interface (UPI, 2023), alongside cross-border QR interoperability with Indonesia (2023), which the authors view as empirical stepping stones toward the multilateral Nexus framework[1]. For underlying cross-border architectures, see From PayNow–PromptPay to Payment Connect: How Fast Payment Systems Turn into Cross-Border Networks, From Bilateral Linkages to Multilateral Network: How Nexus Rearchitects Instant Cross-Border Payments, and Same Code to Scan, Why Can't It Work Everywhere? QRIS, Global QR Payment Standards and Cross-Border Interoperability. For tokenized deposit mechanics, see Tokenized Deposits: How Commercial Bank Money Enters the On-Chain World; for the tokenized central bank settlement model developed in Hong Kong, see What Money Settles Tokenised Assets? A Reading of the HKMA's EnsembleTX.
On why PvP eliminates principal settlement risk in currency exchanges, see What Is the Most Dangerous Moment in FX? Why PvP Is the Market's "Payment-versus-Payment". The fiat conversions anchoring both sides of a stablecoin sandwich lack PvP mechanisms: users disburse one asset before receiving another, bearing direct counterparty exposure to the intermediary exchange.
6. Implications for Different Institutions
For large commercial banks, high retail foreign exchange margins face growing competitive discipline from MTOs and emerging stablecoin alternatives. The paper's empirical findings suggest that competitive pressure bears down most directly on fee transparency and last-mile account crediting delays.
For regional and community banks, renting third-party B2B fintech platforms provides a viable path to deliver modern cross-border payment capabilities without constructing proprietary correspondent networks. The trade-off lies in dependency on third-party pricing, which remains uncompetitive in illiquid emerging market corridors.
For MTOs, stablecoins represent an emerging treasury instrument to rebalance internal liquidity and economize on prefunded balances across select corridors. However, exchanges and crypto gateways become new counterparty exposures, shifting operational and credit risk.
For financial regulators, supervisory focus concentrates on fiat on/off-ramp interfaces: assessing exchange and issuer solvency, determining the locus of AML compliance, and managing the macro-financial spillovers of stablecoin liquidity on domestic currency stability and capital control enforcement.
7. Five Questions for Evaluating a Cross-Border Rail
Synthesizing the paper's empirical framework with the IMF discussion yields five diagnostic questions for assessing any cross-border payment mechanism:
- What is the true all-in cost under a unified measurement standard, encompassing both foreign exchange markups and explicit administrative fees?
- Who prefunds liquidity, and does underlying market depth accommodate large transaction sizes without excessive slippage?
- What monetary asset serves as final settlement, and within which legal and technical infrastructure does finality occur?
- Who absorbs the operational overhead of compliance and customer support, and is that overhead reflected transparently in consumer pricing?
- When operational failures or settlement disputes arise, what statutory legal recourse is available to the end user?
Adrian further recommends evaluating cross-border arrangements across four simultaneous dimensions—cost, speed, access, and transparency—noting that traditional payment modernizations in recent years have centered primarily on transaction speed, whereas this literature focuses predominantly on all-in costs[2].
Conclusion
This working paper deconstructs the generic claim that "cross-border payments are expensive" into an auditable ledger of specific frictional costs. Wholesale foreign exchange markets in major currencies are already remarkably liquid and cheap; the high expense of retail bank wires originates within multi-tiered correspondent chains and retail pricing power. Money transfer operators reduce costs by prefunding liquidity and netting opposing payment flows domestically, transforming cross-border remittances into paired local transfers, though they remain dependent on commercial banking partners and wholesale FX liquidity. Stablecoins achieve cross-border token transmission for pennies, yet fiat on-ramps, off-ramps, exchange commissions, and issuer credit quality reconstitute an entirely new layer of intermediation.
The authors conclude with a prescient observation: in the future of cross-border payments, governance and compliance will prove just as decisive as technological innovation[1]. Viewed through an infrastructure lens, competition across payment rails ultimately hinges on who can deliver trustworthy fiat gateways, robust liquidity depth, and unambiguous legal recourse at the lowest sustainable cost. The pricing advantages displayed by stablecoins in emerging markets stem largely from domestic capital controls and will evolve alongside regulatory adjustments and market deepening; what is far more likely to endure is their utility as back-office treasury instruments to optimize prefunded capital requirements.
References
[1]: Wenxin Du, Catherine Huang and David Scharfstein, Competing rails for cross-border payments: banks, fintechs, and stablecoins, BIS Working Papers No 1385, Bank for International Settlements, October 2026 (published on the BIS website on October 19, 2026). https://www.bis.org/publications/working-paper-1385-competing-rails-crossborder-payments-banks-fintechs-and-stablecoins ↩
[2]: Tobias Adrian, Discussion of "Competing Rails for Cross-Border Payments: Banks, Fintechs and Stablecoins" by Du, Huang, Scharfstein, June 2026, included in BIS Working Papers No 1385. https://www.bis.org/publications/working-paper-1385-competing-rails-crossborder-payments-banks-fintechs-and-stablecoins.pdf ↩
[3]: U.S. Government Publishing Office, Public Law 119-27: Guiding and Establishing National Innovation for U.S. Stablecoins Act, 18 July 2025. https://www.govinfo.gov/app/details/PLAW-119publ27 ↩
[4]: Iñaki Aldasoro, Paula Beltran and Federico Grinberg, Stablecoin Inflows and Spillovers to FX Markets, IMF Working Paper No. 2026/056, International Monetary Fund, 2026. https://www.imf.org/en/publications/wp/issues/2026/03/27/stablecoin-inflows-and-spillovers-to-fx-markets-575046 ↩
Originally published by Luminale Fintech Observer: https://luminale.cn/articles/bis-competing-rails-cross-border-payment-costs-en